

|
1 2 3 4 5 6 7 8 9 10 11 12 13 14 15 16 17 18 19 20 21 22 23 24 25 26 27 28 29 30 |
struct Plot { sf::Image m_image; sf::Texture m_texture; sf::Sprite m_sprite; sf::Color m_color; std::string m_info; int thickness; //*************************************************** Plot(int w, int h){ create(w,h); thickness = 3; m_color = sf::Color::Red; } void create(int w, int h){ m_image.create(w,h,sf::Color(0,0,0,0)); update(); } void add_point(int x, int y){ setPixel(x,y); if(thickness == 3){ setPixel(x,y+1); setPixel(x,y-1); setPixel(x+1,y); setPixel(x-1,y); } } void setPixel(int x, int y){ if( 0 <= x && x < m_image.getSize().x && 0 <= y && y draw(m_sprite); } }; |
|
1 2 3 4 5 6 7 8 9 10 11 12 13 14 15 16 17 18 19 20 21 22 23 24 25 26 27 28 29 30 31 32 33 34 35 36 37 38 39 40 |
struct Plots { std::vector vec; sf::Image image; sf::Texture texture; sf::Sprite sprite; //************************************* Plots(int w, int h, sf::Color c = sf::Color::White){ image.create(1,1,c); texture.loadFromImage(image); sprite.setTexture(texture); sprite.setTextureRect(sf::IntRect(0,0,w,h)); } void draw(sf::RenderWindow* window){ //window->draw(sprite); for(int i=0; idraw(window); } // w,h - размеры поля, a-амплитуда,f-фаза(от 0 до 2*PI),da-амплитудный сдвиг,df-фазовый сдвиг void add_plot(std::string info, sf::Color color, int w, int h, float a, float f, float da=0, float df=0){ if(info == "sin") vec.push_back( create_sin(color,w,h,a,f,da,df) ); } Plot* create_sin(sf::Color color, int w, int h, float a, float f, float da, float df){ Plot* p = new Plot(w, h); p->m_color = color; p->m_info = "sin"; float y = 0; float yprev = h/2 - da + a*sin(df*PI*2/f); for(int i=0; iadd_point(i, yprev); } else if(y < yprev) { for(int j=y; jadd_point(i, j); } else { for(int j=yprev+1; jadd_point(i, j); } yprev = y; } p->update(); return p; } }; |
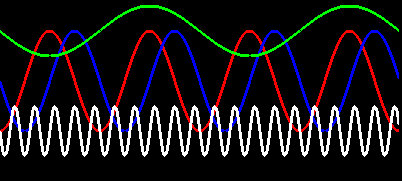
Использование в main.cpp:
|
1 2 3 4 5 6 7 8 9 10 11 12 13 14 15 16 17 18 19 20 21 22 23 24 25 26 27 28 29 30 |
#include <iostream> #include <SFML/Graphics.hpp> #include "math.h" using namespace std; // struct Plot // struct Plots int main(){ Plots plots(1000, 500); plots.add_plot("sin",sf::Color::Red, 400, 300, 50, 100, 0, 25); plots.add_plot("sin",sf::Color::Blue, 400, 300, 50, 100, 0, 0); plots.add_plot("sin",sf::Color::Green, 400, 300, 25, 200, 50, 0); plots.add_plot("sin",sf::Color::White, 400, 300, 25, 20, -50, 0); sf::RenderWindow window(sf::VideoMode(1100,600), "SFML"); while(window.isOpen()){ sf::Event event; while(window.pollEvent(event)){ if(event.type == sf::Event::Closed) window.close(); } window.clear(sf::Color::Black); plots.draw(&window); window.display(); } return 0; } |